
A run rate is basically a way of “annualizing” information about a company like sales or profits.
You’ve seen and used run rates your whole life, even if you haven’t actually thought of them in those terms before. For example, whenever a news bulletin reads “MegaCorp earned $1 million in the first quarter, projecting $4 million annually” – that’s run rate.
Calculating a run rate can be a useful data point in many scenarios, but over-relying on it can hurt your business in the long run. With this article, you’ll find out exactly what it’s good for.
Run Rate Calculations: Calculate Run Rate

Calculating run rate is pretty easy. Take revenue over a period of time – typically a month or quarterly revenue – and multiply it to get a year’s worth of revenue – typically by 12.
Simply put, the calculation is:
Revenue in period (Y)
Multiplied by
Number of periods (Y) in one year
Equals
Annual run rate
4 Uses of Run Rate
1- Customer Acquisition
First off, the run rate helps you know how much to spend on customer acquisition. Perhaps you’ve analyzed a monthly profit of $500,000 and you calculate the annual run rate to be $12 million. That indicates you should be spending $12 million in total this year to break even.
This even works for when your company is experiencing rapid rises and falls in revenue. Calculating the sales run rate for a few different months can give you highs and lows for spending, narrowing your window into what’s likely to be the most accurate estimate.
2- Talent Acquisition
Second, you can use it as a quick metric for thinking about hiring. If your calculation shows that you’ll be doing three times the business come this period of time next year, you will definitely want to ramp up the hiring now to account for how long it might take to find top talent.
Hiring and onboarding is one of the longest processes that you can go through for growth, especially in the current economy with low unemployment.
3- When Data is Sparse
Revenue run rate is also ideal when you simply don’t have lots of data. Whether you’re a new business or just newly profitable, run rate is the first metric available to you for making internal predictions.
Emphasis on “internal”! As it’s little more than a simple extrapolation, you don’t want to be bringing revenue run rate up in a meeting with investors. You can also calculate a more short-term extrapolation, particularly in the first few weeks after a major product change.
4- Set Goals
Lastly, since there are few if any real calculations involved, it’s great for setting personal goals, like for a support or sales team.
Did your support staff get 50 completed surveys in February and 30 in March? Take the average of that, 40, and multiply by 12 to get your yearly target for survey completion. Goals like that are easy to scale down to weekly or monthly targets based on previous patterns.
The Risks of Using an Annual Run Rate (ARR)
First and foremost, revenue run rate has the same problem as any forecasting tool. It’s simply impossible to foresee sudden shake-ups in the future.
Imagine you’re looking over a company’s books that has posted $60,000 for the third quarter. Looking at the third quarter’s sales, you might think that the annual sales revenue would be that figure multiplied by four, or $240,000.
Then you turn to the next tab of the binder and see that oh, actually they had a viral moment on social media in the fourth quarter and their revenue shot up 150%. Or that viral moment went to a competitor (or you got cancelled on Twitter) and the revenue dropped by 25% instead. Seasonality could also result in the same issue.
No Data, No Conclusions
You also risk extrapolating too much from too little data. We can take that to its logical conclusion: would you put much faith in a run rate calculated from one week’s activity, multiplied by 52? How about one hour’s, multiplied by 8,760?
Essentially, you’re assuming that your business will continue exactly like it has for whichever month or quarter (the two most common run rates). That’s just plain unrealistic.
Think of that survey completion example from just a moment ago – if your customer base grows significantly over the next 10 months, your goal will essentially be to underperform compared to the first two months of the year. As mentioned, it’s not bad for a quick and dirty calculation, but run rate should definitely be combined with other metrics when available.
And these aren’t hidden drawbacks – you probably thought of them yourself already. That means if you use a run rate in your marketing materials or investment pitches, people are going to see right through it and probably assume that you have something to hide.
Arriving at a Better Run Rate
With all of these downsides listed, is it really too dangerous to use run rate at all? Not exactly.
If you simply take your monthly revenue at face value, it might. However, you can calculate your true monthly recurring revenue with a simple formula.
Take your baseline revenue at the beginning of the month, add new revenue from new customers, and subtract any revenue lost from customers leaving (churn) or downgrading their price point.
Multiplying that figure by 12 is going to give you a far more accurate prediction – leaving out, of course, any viral moments that might come your way.
Let’s say your baseline revenue was $1,000 at the beginning of the month. You’ve lost two customers paying $10 per month from the month previous, so we subtract that $20 and get $980. However, you gained eleven new customers and they couldn’t be happier: in total you’ve got $1090 instead of $1000 that you can run with to get an annual projection. Obviously, when this scales up the differences become quite drastic!
Conclusion
Running a calculation with run rate should be something you can do without thinking. It’s good for fast solutions, or when you don’t have that much data to begin with and you need some quick estimations.
However, when it comes time to meet with investors or write a press release, stay away from simple multiplication. Do something as easy as calculating the monthly recurring revenue and get a more accurate figure, or better yet, model your revenue with something more statistically robust.
The most crucial thing is to keep good metrics of your financials. Do that, and apply the best tool for the job, and you’ll be set to make the best decisions you can.
Recent Articles
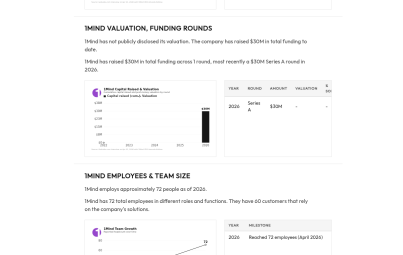
How 1Mind Achieved Rapid Revenue Growth with AI-Powered Sales Solutions
In the ever-evolving world of technology, few companies have managed to disrupt traditional sales and marketing processes as effectively as…
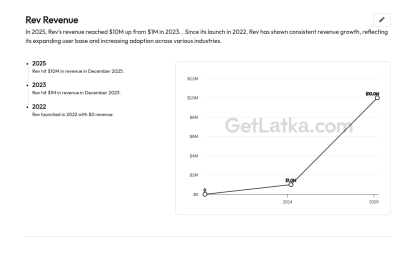
How Rev's CEO Adi Bathla Drove Revenue to $10M by Revolutionizing Auto Shop Workflows
Building a company from scratch and driving it to hit significant revenue milestones is no small feat. Adi Bathla, the…
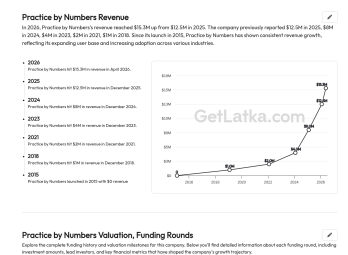
How Practice by Numbers Achieved $16.5M Revenue in 2026 with Innovative SaaS Solutions
2015: Launched Practice by Numbers to Fill a Market Gap Practice by Numbers (PBN), co-founded by Rohit Garg and Dr.…