There is no doubt that losing customers can be detrimental to any business.
That’s why calculating your company’s churn rate is vital in helping you spot an increase in lost customers; basically, you can take action to retain your customers before customer churn seriously damages your business.
Nonetheless, many companies find calculating their churn rate challenging since there are many different churn rate formulas to choose from.
As such, some companies spend too much time trying to figure out the correct way to calculate churn rate and understand these complex calculations instead of actually taking action to minimize customer churn.
However, calculating your churn rate doesn’t have to be difficult and we’ll show you exactly how to do it.
So, in this article, we will cover all about churn rate, including:
- What is Customer Churn?
- What’s Churn Rate?
- How to Calculate Churn Rate
- Why is Churn Rate Important?
- What’s an Acceptable Churn Rate?
- Churn Rate Examples From SaaS Companies
What is Customer Churn?
Simply put, customer churn, or customer attrition, is what happens when customers or subscribers no longer use your business’ products or services.
In other words, customer churn happens when a customer is no longer a customer.
What’s Churn Rate?
To calculate customer churn, companies use the customer churn rate metric.
Churn rate is a SaaS metric that measures the rate at which customers stop using your services or products over a specific time period, which is typically a month.
This rate is expressed as a percentage of lost customers in contrast to your total customers.
A high churn rate, in turn, means that your business is rapidly losing customers and revenue.
As such, your churn rate is an essential metric that can help you to:
- Measure and keep track of your business’ health
- Forecast future business growth
- See whether you need to improve your customer retention and customer satisfaction
- Evaluate if your customer retention and customer satisfaction is improving on a monthly basis
- Predict and help to prevent revenue loss
How to Calculate Churn Rate
Now that we’ve defined churn rate, let’s see how you can calculate your company’s churn rate yourself.
Although there are different formulas that companies use to calculate their churn rate, there’s no need to complicate your churn rate calculations.
After all, it’s much more valuable to use your time to figure out how you can actually improve your business than to waste it trying to make sense of complex calculations.
So, to help you save time, we will share an easy-to-understand churn rate formula that you can use for your business.
Churn Rate Formula
This simple formula will help you to calculate your company’s churn rate:
Churn rate = (number of churned customers over a specific time period / total number of customers at the start of that time period) x 100
So, let’s see how you could calculate your company’s churn rate using this formula.
Let’s say your company had 5000 customers at the beginning of the month and lost 300 customers over the month. So, by the end of the month, your company had 4700 customers.
Here’s how you’d calculate your company’s churn rate in this case:
(300 / 5000) x 100 = 6%
By using the formula, we can see that your company’s churn rate is 6%.
Why is Churn Rate Important?
Generally speaking, some customer churn is normal – after all, you can’t expect all of your customers to keep using your services or products forever.
If your churn rate is high or rapidly increasing, however, it could seriously affect your business in several ways, such as preventing its growth, damaging its reputation, and causing financial losses.
Impacted Business Growth
If your business is quickly losing customers, it can seriously damage your future growth potential.
If you’re looking to introduce new services, products, or features into your business, for example, you may not have the necessary funds to implement these business ideas with a high churn rate because losing your customers also means that your business is losing revenue.
And, if you do have the funds for new business ventures, they may not be as successful if your company has a high churn rate.
That’s because your existing customers typically are your best target audience – in fact, research shows that existing customers are 50% more inclined to try new products than new customers.
Because of this, a customer base that is getting smaller each month can negatively affect your business’ health and prevent future business growth and success.
Damaged Brand Reputation
Customers often cut ties with a company because they aren’t satisfied with it, whether it’s due to a low-quality product, lack of customer support, or any other unmet expectations.
For this reason, having a high churn rate could potentially lead your business to receive negative reviews and ratings, which can take a toll on your brand reputation.
Not to mention, a damaged brand reputation can also harm your business growth by making it more difficult to attract new customers to your business.
So, if you see that your churn rate is increasing, it may be beneficial to work on improving customer satisfaction before you lose more customers.
Increased Expenses
Depending on your industry, customer acquisition costs (CAC) can be 5 to 25 times higher than the cost of retaining your existing customers.
For this reason alone, having a high churn rate can affect your business’s financial health, since losing customers results in revenue loss as well as increased expenses for acquiring new customers.
As such, if your company has a high churn rate, you might want to focus on increasing your customer retention so that you can avoid any financial problems that come from losing your customers.
What’s an Acceptable Churn Rate?
Churn can be correlated to many things, but it’s most closely correlated to the price point, which is why it’s important to do a churn analysis.
If you’re selling cheap, $100/yr plans to small businesses, your churn rate will be higher than a company selling $250k/yr plans to the Fortune 500.
Is My Churn Rate Good or Bad?
Think about churn in buckets related to price point, revenue stage of the company, and funded vs. bootstrapped.
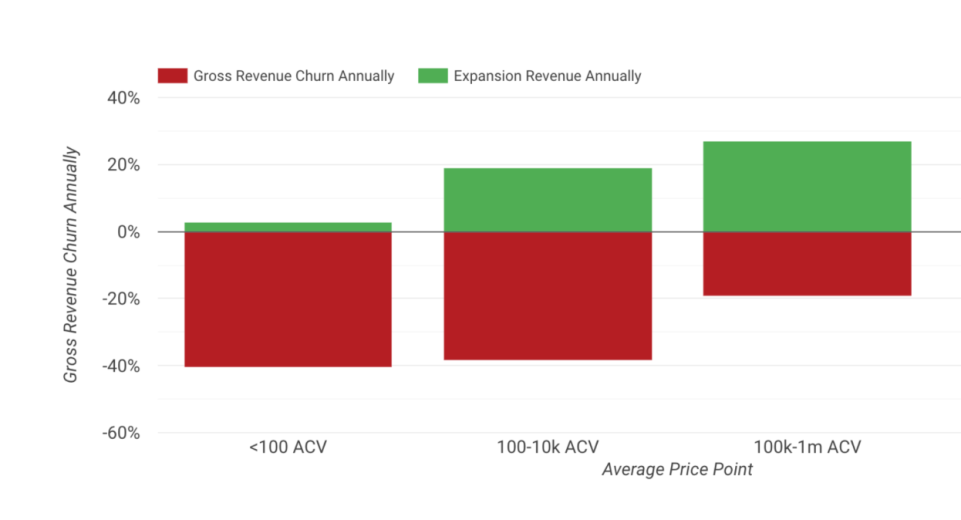
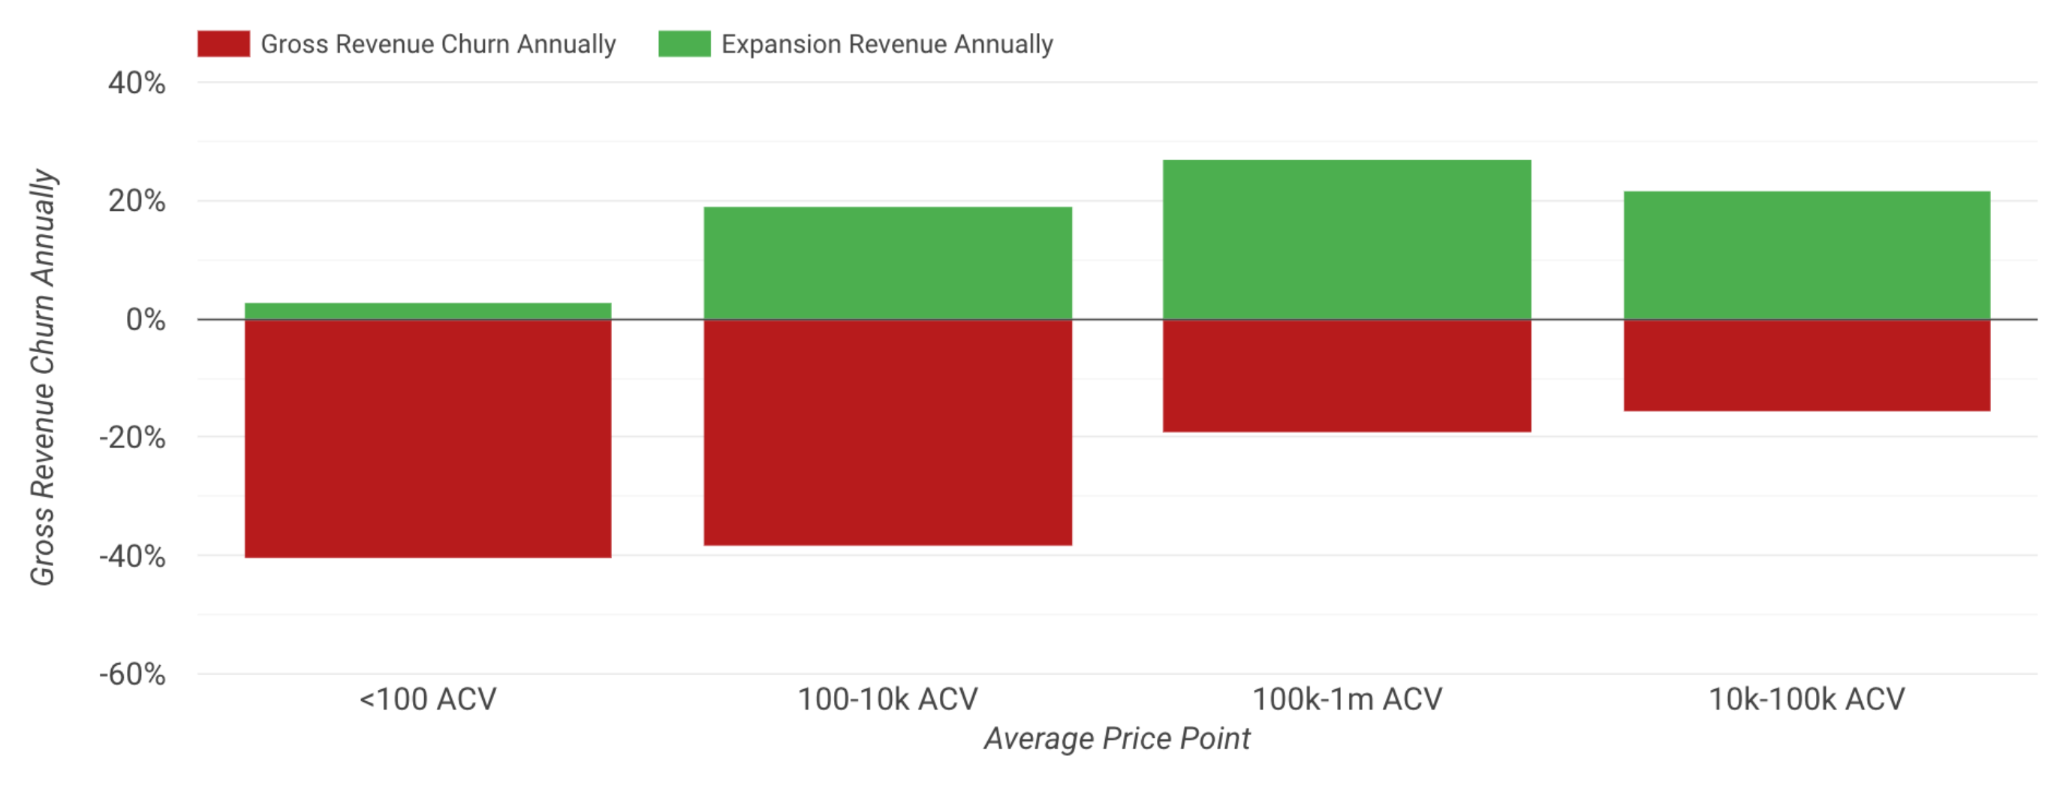
- <$100/yr price point, revenue churn up to 30% annually is acceptable, under 5% annually would be world-class. Avg is 40%, as seen below.
- $100-$10k/yr price point, revenue churn up to 20% annually is acceptable, under 3% would be world-class. Avg is 38%.
- $10k-$100k/yr price point, revenue churn up to 10% annually is acceptable, under 1% would be world-class. Avg is 17%.
- $100k+/yr price point, revenue churn up to 5% annually is acceptable, under 1% would be world-class. Avg is 19%.
Churn Rate Examples From SaaS Companies
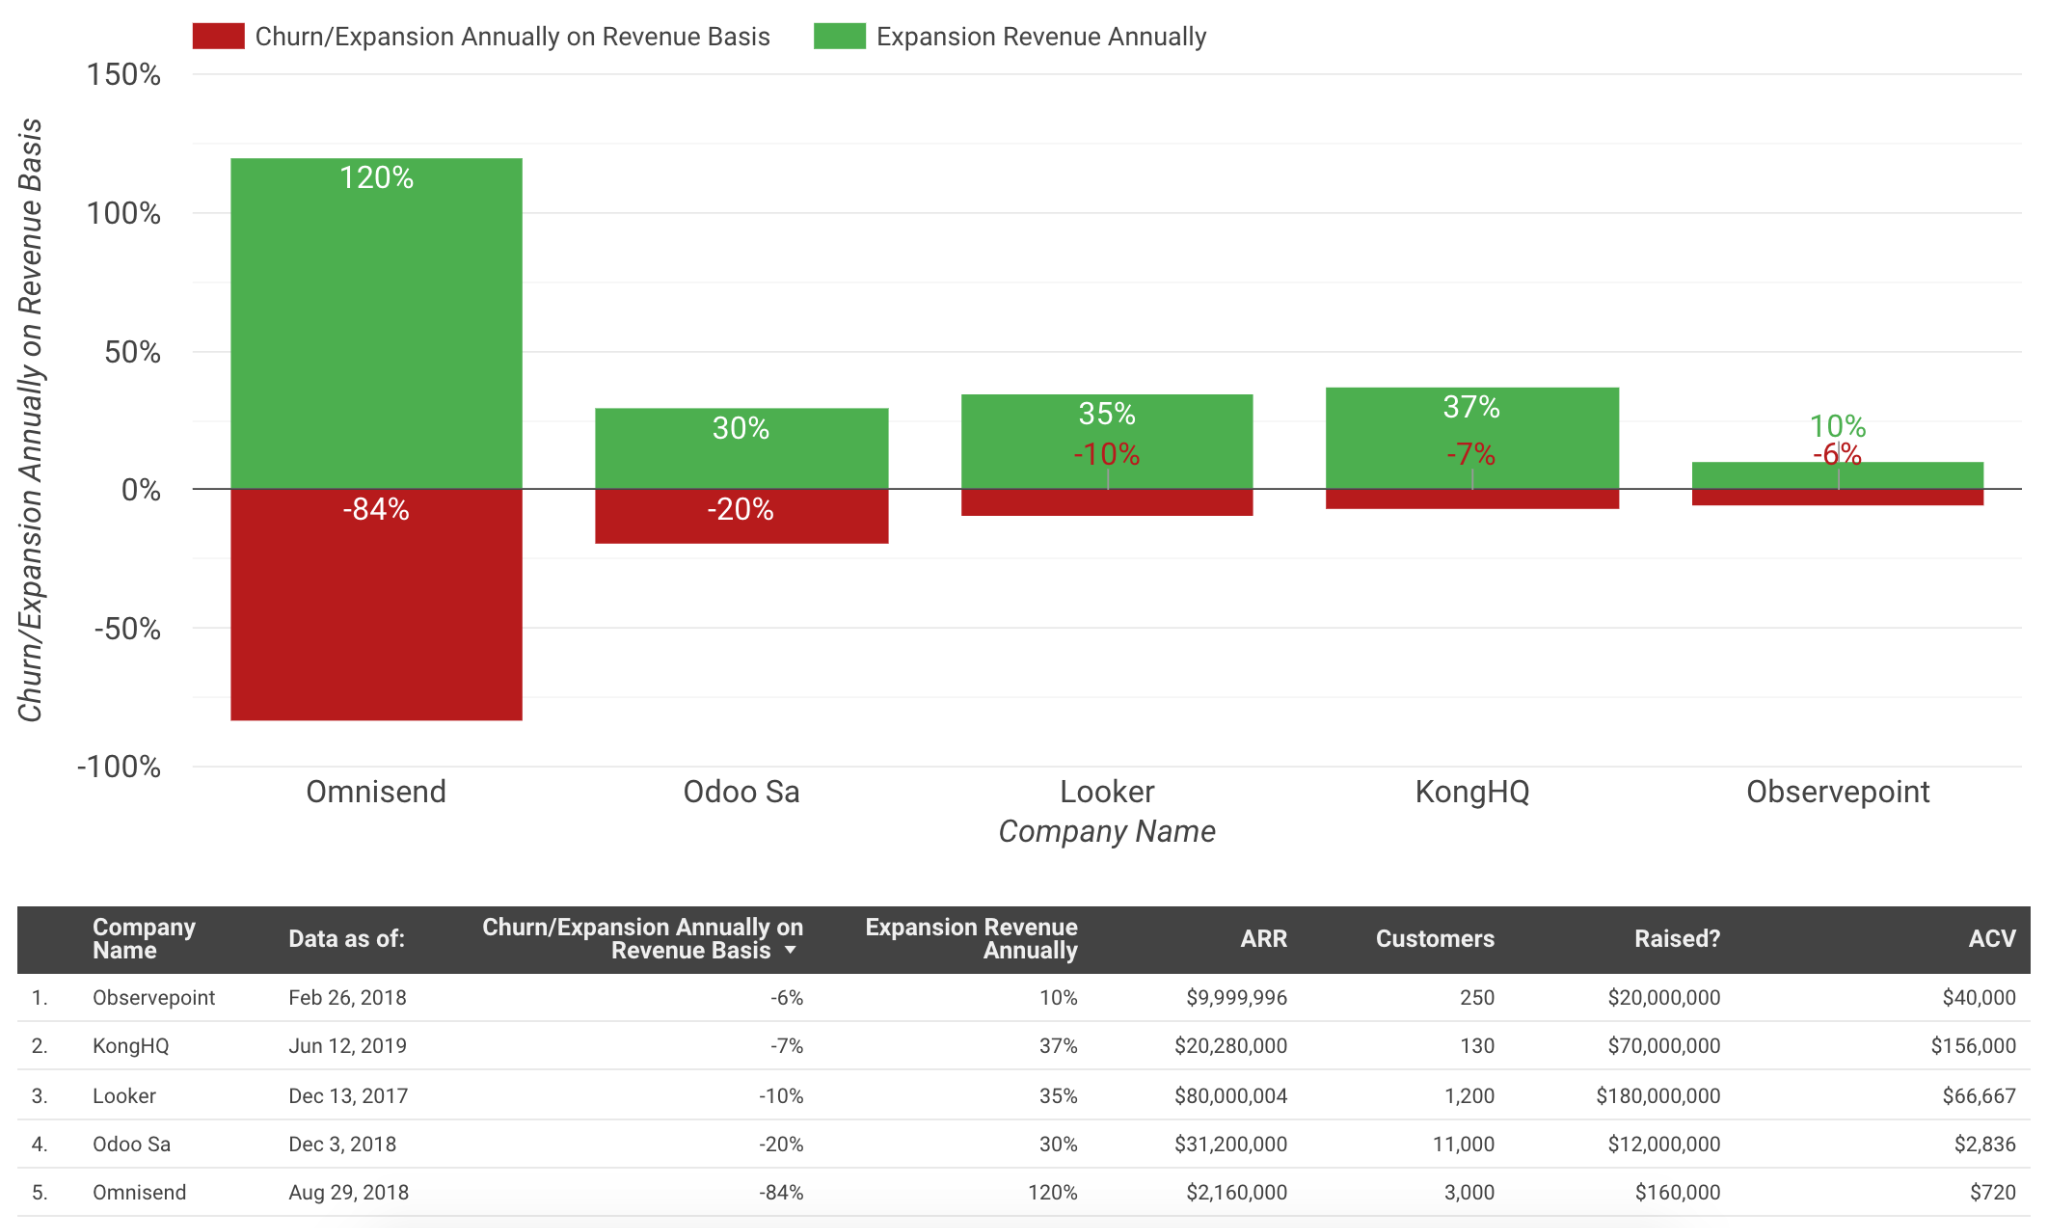
So now you have an understanding of different churn profiles; here are a couple of real-life examples pulled out of this data set.
Notice Omnisend has the highest churn with the lowest ACV. Looker was acquired for $2b+ with under 10% churn and 35% expansion.
Last, if you’re looking for strategies to manage your churn, have a read of our churn management guide.
Key Takeaways
And that’s all you need to know about churn rate and its importance to your business success.
By now, you should also have better grasped how to calculate your company’s churn rate.
Before you go, though, here’s a run-through of the key points mentioned in this article:
- Customer churn describes the phenomenon of losing customers.
- The churn rate calculates the rate at which customers stop using your services or products over a specific period, which is typically one month.
- Keeping track of your company’s churn rate can help you to evaluate your business health, improve and track customer retention and satisfaction rates, as well as forecast future business growth.
- To calculate your company’s churn rate, you should divide the number of lost customers over a specific period by the number of total customers over the same period and multiply this number by 100.
- A high churn rate can be detrimental to your business and result in impacted business growth, damaged brand reputation, and financial problems.
Recent Articles
How Rev's CEO Adi Bathla Drove Revenue to $10M by Revolutionizing Auto Shop Workflows
Building a company from scratch and driving it to hit significant revenue milestones is no small feat. Adi Bathla, the…
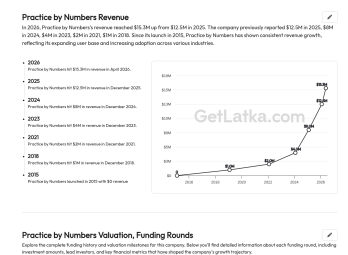
How Practice by Numbers Achieved $16.5M Revenue in 2026 with Innovative SaaS Solutions
2015: Launched Practice by Numbers to Fill a Market Gap Practice by Numbers (PBN), co-founded by Rohit Garg and Dr.…
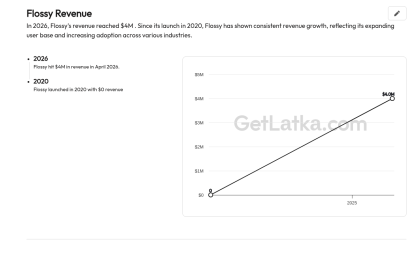
How Flossy Achieved $4M Revenue and Continues to Grow with AI Innovations
In a rapidly evolving world, where technology and healthcare intersect more intricately than ever, Flossy has emerged as a beacon…